
I’ve recently been reflecting on how our approach to technology projects is not only about creating tools but about unlocking new abilities that can transform the way businesses operate. Our unique strength lies in our ability to break down any technology project into its fundamental components—Investment Cost (IC), Operational Returns (OR), Operational Return Rate (ORR), Improvement Returns (IR), and Additional Revenue (AR). Each of these metrics gives us a window into the business’s performance and potential.
Defining the Core Metrics
- Operational Returns (OR):
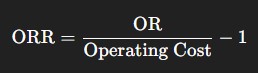
The money generated by operations annually. Think of it as the heartbeat of the business—what’s earned over a year. - Operational Return Rate (ORR):
This is calculated as the ratio of OR to the operating costs, minus one. In simple terms, it’s how much return we generate for every peso spent. - Investment/Improvement Cost (IC):
This is the cost of our technology or improvement projects. Whether it’s deploying ERP systems like ERPnext or other tech tools, our investment typically falls in the 200K–400K PHP range. In the broader industry, investments can be upwards of 1–2M PHP, but we stand out by offering precision – clients only pay for the hours they actually use, instead of an inflated blanket rate. - Improvement/Investment Returns (IR):
IR represents the change in the status quo. It accounts for savings (which lift the ORR) and any additional income generated. Essentially, it’s the sum of cost savings and extra revenue—our IC plus all the benefits. - Additional Revenue (AR):
The difference between what was earned before the project and what we earn after its implementation.
Why Savings are a Game-Changer
What’s most striking is that SAVINGS—making the same amount of money with lower operational costs—drives a much more robust ratio of cost to earnings. This scaling effect is the cornerstone of why many companies struggle: they simply aren’t measuring it. Without a Quality Management System (QMS) to map out processes and simulate input vs. output, companies miss out on revealing these underlying ratios.
One critical realization is that, in large organizations, the larger the numbers (and the more predictable the averages), the more reliable these ratios become. You can almost predict a company’s earnings by evaluating a few key demographics: the number of employees, average pay, size of facilities, etc. This derivability is what makes it all “knowable.”
Turning Knowability into Competitive Advantage
Imagine a team like ours harnessing AI to model and simulate these ratios with an accuracy of 10%—that’s a game changer. [Tag: Potentially offensive language] In this fast-paced era, “You fucking move fast and forward” isn’t just a rallying cry; it’s the reality. We use AI and automation not just to catch up but to carve out new markets by investing in “ice breakers” that open up untapped opportunities.
Moreover, once you standardize these analytical techniques and share the knowledge, your organization’s business development arm transforms. When 3–7 people are trained in this methodology, equipped with the right QMS, and empowered with productivity tools, your capacity for innovation skyrockets. The process is iterative: as these teams succeed, they mentor a younger, dynamic cohort that can experiment with new hypotheses. This new wave of business development is less predictable, more creative, and ready to disrupt the norm.
Building a Model for the Future
In our world, where every process is measurable, every cost is forecastable, and every return is scrutinized, the secret to scaling up is clear. A simple spreadsheet model—with columns for assumptions, costs, formulas for OR, ORR, IR, IRR, and a running list of milestones—provides a live blueprint for progress. As new milestones are defined, the model is refined, continuously moving the needle on performance.
Here’s what the core of our model looks like:
- Input Parameters:
- Operating Cost (OC): Estimated from WIP, labor, and manpower.
- Revenue (OR): The total annual earnings.
- Investment Cost (IC): The tech/service cost.
- Additional Revenue (AR) & Savings: The extra income or saved costs post-improvement.
- Output Metrics:
- Baseline ORR:

- New ORR (post-improvement):

- Improvement Return (IR):
 `
` - Improvement Return Rate (IRR):

- Baseline ORR:
This model isn’t static—it grows with every milestone and every insight we gain. In a competitive landscape where sharing the wealth of knowledge leads to collective success, our approach lays the groundwork for a future where knowable secrets are reinvented, and continuous innovation is the norm.
Final Thoughts
Being in manufacturing, construction, and services grants us a multifaceted perspective on business operations. Our deep industry insights combined with our forward-thinking technology investments enable us to not just predict outcomes but actively drive them. We’re not simply measuring numbers—we’re creating a culture of continuous learning, experimentation, and measurable growth.
By empowering each team member with these tools and methodologies, we are effectively democratizing high-level analysis. And as our teams grow and our technologies evolve, the line between what’s knowable and unknowable blurs into a dynamic canvas, ready for the next breakthrough.
Let’s continue to harness this power, sharing our insights and evolving our processes—not merely to keep pace but to lead the charge into uncharted territories.
Leave a Reply